As a seasoned trader, I’ve seen the markets’ ups and downs. These changes can greatly affect a portfolio. Candlestick patterns have become key for me. They help us understand market movements, guiding us through trading’s challenges.
In this article, we’ll explore candlestick patterns. We’ll look at their history, importance, and how to use them for trading. Whether you’re new or experienced, knowing candlesticks can help you succeed in trading.
Key Takeaways
- Candlestick patterns show price movements, revealing open, close, high, and low prices.
- They have a long history, starting in 18th century Japan, and are now crucial in technical analysis.
- These patterns offer insights into market mood, signaling when to buy or sell.
- Knowing candlestick anatomy and patterns is vital for good trading strategies.
- Using candlestick analysis with other tools can improve your trading skills and adapt to market changes.
Introduction to Candlestick Patterns
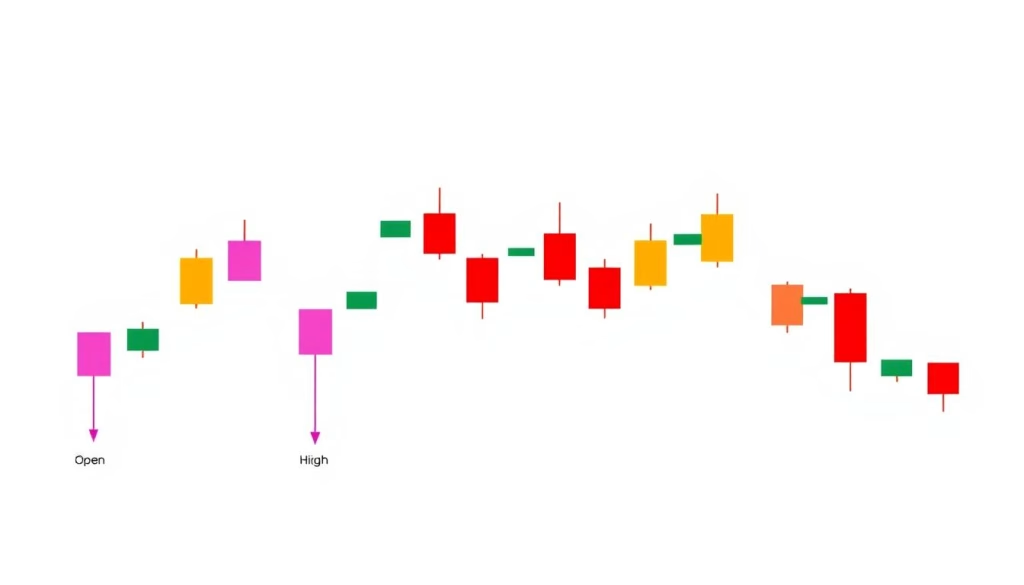
Candlestick charts have been key in technical analysis for over a century. They offer traders a unique way to see market movements. These charts show the candlestick anatomy, candlestick components, and candlestick structure. They include the open, high, low, and close prices for a time period.
The Anatomy of a Candlestick
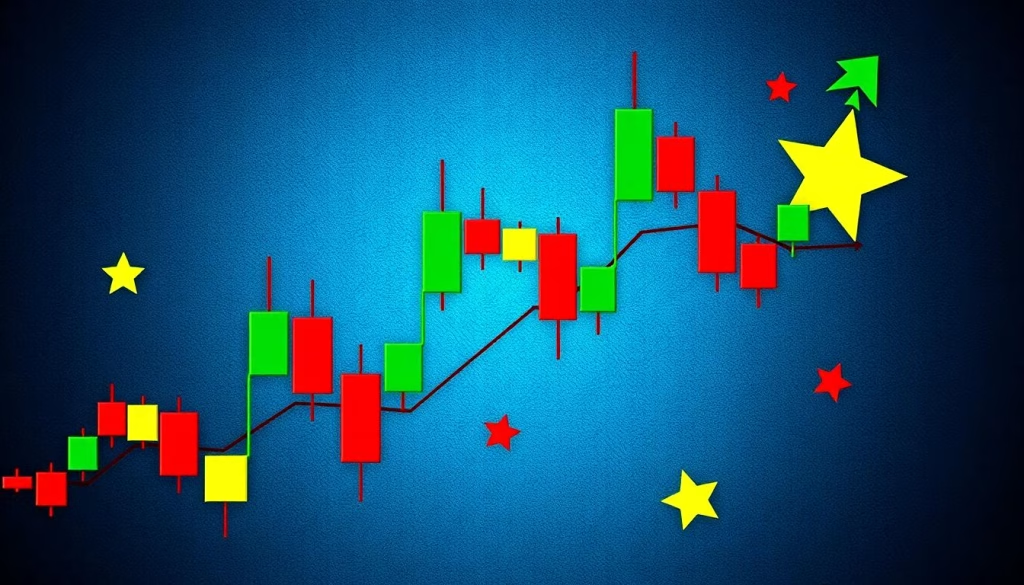
A candlestick chart’s core is the candlestick itself. It has a thick “body” showing the range between open and close prices. Thin “wicks” or “shadows” show the high and low prices. The color of the body tells if the close was higher (green or white) or lower (red or black) than the open.
The Origin of Candlestick Charting
The history of candlestick charts starts in the 18th century with Japanese rice traders. Munehisa Homma, a famous Japanese rice merchant, used this method in the 1700s. Later, Sokyu Honma introduced it to the West in the early 20th century.
But it wasn’t until Steve Nison’s 1991 book, “Japanese Candlestick Charting Techniques,” that it became well-known in the West.
Why Candlestick Patterns Matter in Trading
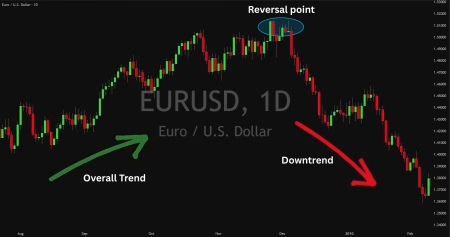
Candlestick patterns are key in trading. They give insights into market mood and future price moves. These patterns show if a trend is changing or staying the same.
Bullish patterns, like the Hammer and Inverted Hammer, signal a move from down to up. This is a good time to buy. Bearish patterns, such as the Bearish Engulfing and Piercing Line, show a move from up to down. This is a sign to sell.
Continuation patterns mean the trend will likely keep going. Patterns like the Bullish Harami and Three White Soldiers help traders join the trend. Indecision patterns, like the Doji, often mean a trend change is coming. They show a fight between buyers and sellers.
| Candlestick Pattern | Success Rate |
|---|---|
| Hammer | 60% |
| Inverted Hammer | 67% |
| Bullish Engulfing | 62% |
| Piercing | 64% |
| Morning Star | 78% |
| Three White Soldiers | 84% |
| White Marubozu | 71% |
| Three Inside Up | 65% |
| Bullish Harami | 53% |
The data shows how well certain bullish reversal patterns work. They help spot trends and when to enter the market. Knowing these patterns helps traders make better choices and succeed more often.

Understanding Basic Candlestick Patterns
Exploring technical analysis, you’ll find candlestick patterns are powerful. They show price movements and market sentiment. Let’s look at common bullish and bearish patterns and what they mean.
Bullish Candlestick Patterns
Bullish patterns show a shift from downtrend to uptrend. They indicate buyers are taking control. Key bullish patterns include:
- Bullish Engulfing: A big green/white candlestick covers a small red/black one, hinting at a trend change.
- Piercing Line: A big green/white candlestick opens below the last red/black’s low and closes above its midpoint, showing buying strength.
- Morning Star: This pattern has three candlesticks: a long red/black, a small green/white, and a large green/white. It signals a strong bullish reversal.
- Three White Soldiers: Three green/white candlesticks in a row, each higher than the last, show steady buying pressure.
These patterns are strong signs of a trend change. They help traders make better decisions.
Bearish Candlestick Patterns
Bearish patterns signal a shift from uptrend to downtrend. They show sellers are gaining control. Common bearish patterns are:
- Bearish Engulfing: A big red/black candlestick covers a small green/white one, hinting at a trend change.
- Evening Star: This pattern has three candlesticks: a long green/white, a small red/black, and a large red/black. It signals a strong bearish reversal.
- Three Black Crows: Three red/black candlesticks in a row, each lower than the last, show steady selling pressure.
Knowing these bearish patterns helps traders spot market shifts. It aids in making informed trading choices.
Candlestick patterns are just one tool in technical analysis. Using them with other indicators and strategies gives a deeper understanding of markets. This helps in making better trading decisions.
Advanced Candlestick Patterns for Trading
In the world of technical analysis, advanced candlestick patterns are key. They help spot trend reversals and continuation signals. These complex patterns offer a deeper look into market dynamics.
Complex Candlestick Formations
Some advanced candlestick patterns are known for signaling market turning points. The island reversal pattern hints at a trend reversal, making traders wait for confirmation. The hook reversal pattern also signals a trend change, urging traders to confirm before acting.
The triple gap (San-ku) candlestick pattern often signals a trend reversal. Traders wait for more confirmation before trading. The kicker candlestick pattern is a strong reversal indicator, prompting traders to set stop-losses to manage risks.
Analysing Patterns: Doji, Hammers, and Shooting Stars
Patterns like the doji, hammer, and shooting star also offer valuable insights. The doji candlestick pattern shows a balance between buyers and sellers, with no net gain. The hammer candlestick pattern signals a potential reversal at the bottom of a downtrend. The shooting star pattern, found in an uptrend, suggests a possible reversal.
Understanding these patterns is vital for traders navigating financial markets. By combining these insights with other tools, traders can make better decisions and enhance their strategies.
| Pattern | Description | Implication |
|---|---|---|
| Island Reversal | Signifies a possible trend reversal | Traders commonly wait for confirmation before executing trades |
| Hook Reversal | Indicates a potential reversal in the current trend | Traders often seek additional confirmation before acting |
| Triple Gap (San-ku) Candlestick | Often signals an impending trend reversal | Traders wait for further confirmation |
| Kicker Candlestick | Considered one of the most powerful reversal indicators | Traders place stop-losses strategically to manage risks |
Applying Candlestick Patterns in Live Trading
Candlestick patterns are key in live trading. They show price movements and help understand market feelings. This knowledge aids in making better trading choices.
Setting Up a Candlestick Chart Live
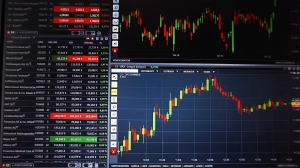
To start live candlestick chart analysis, set up your trading platform. It should show candlestick charts. This lets you see open, high, low, and close prices for each period. It gives a detailed look at price changes.
Live Candlestick Chart Analysis: A Step-by-Step Guide
- Learn the basic candlestick patterns like doji, hammer, and shooting star. They signal when the market might change.
- Look at the overall trend direction. Find candlestick formations that show a trend change, like the engulfing pattern or evening star.
- Check the volume with the candlestick formations. This shows how strong the signals are.
- Use your candlestick pattern analysis with other technical indicators and market data. This helps confirm your trading choices.
While candlestick patterns are useful, they should not be the only tool. Use them with other technical analysis to confirm trends and make smart trading decisions.
“The best way to learn to read candlestick patterns is to practice entering and exiting trades from the signals they give.”
Mastering live candlestick chart analysis helps build a strong trading strategy with candlestick patterns. This strategy boosts your confidence and precision in the markets.
Candlestick Patterns in Cryptocurrency Trading
Candlestick patterns are key in crypto trading, giving traders insights into market mood and price shifts. These patterns come from the open, high, low, and close prices of a digital asset in a set time. They help spot market changes or trends.
The Significance of Bitcoin Candle Charts
In the fast-changing crypto markets, candlestick patterns on Bitcoin and other digital assets are very telling. By studying these patterns, traders can understand market psychology better. This helps them make smarter trading choices.
From simple patterns like the bullish engulfing to complex ones like the morning star, each pattern can reveal trading chances. Automated crypto trading tools also help, making charts and patterns easier to see and understand. This way, traders can spot trends and when to buy or sell.
“Candlestick charts offer comprehensive data including an asset’s opening and closing price, highest and lowest price, and price movement in both short and long-term windows, making them invaluable tools for crypto traders.”
Whether you’re new or experienced in crypto trading, knowing about candlestick patterns is crucial. They are essential for bitcoin candlestick charts and cryptocurrency market analysis. Using this tool can give you an edge and help you make better trading choices in the fast-paced world of candlestick patterns in crypto trading.
Learn Candlestick Patterns: The Ultimate App for Trading Success
Unlock the key to successful trading with Morpher’s candlestick pattern trading app. It’s built on the Ethereum blockchain. This platform is secure and fast, letting you trade stocks, forex, cryptocurrencies, and more.
Morpher offers unique features like zero fees and infinite liquidity. You can also short and trade without counterparties. Plus, it comes with advanced candlestick charting tools from Tradingview, all for free.
- Analyze market trends and patterns with Morpher’s advanced candlestick charting tools
- Build personalized trading strategies using the powerful backtesting and simulation features
- Execute trades seamlessly, all from within the Morpher platform
Whether you’re new or experienced, Morpher’s app will boost your trading skills. Sign up now for a free money bonus. Start trading like a pro on the Ethereum blockchain with Morpher.
“Morpher’s candlestick charting tools have been a game-changer for my trading. The ease of use and comprehensive features have helped me identify patterns and make more informed decisions.”
– John Doe, Successful Trader
Conclusion
Candlestick patterns are key for understanding market feelings and spotting trading chances. They help you grasp the market’s mood and make better choices. By knowing how to read these patterns, you can improve your trading skills.
Candlestick charts are great because they show the market’s emotions. They help traders spot important moments like the hammer and hanging man patterns. These signs can tell you a lot about the market’s strength and where it might go next.
Even though candlestick patterns are useful, they should be used with other tools to get a full picture. Learning to use them well takes time and practice. A good trading platform like Morpher can help by offering advanced tools and access to the market.
By using these patterns wisely, you can gain a deeper understanding of the market. This knowledge can lead to better trading decisions and success.
