


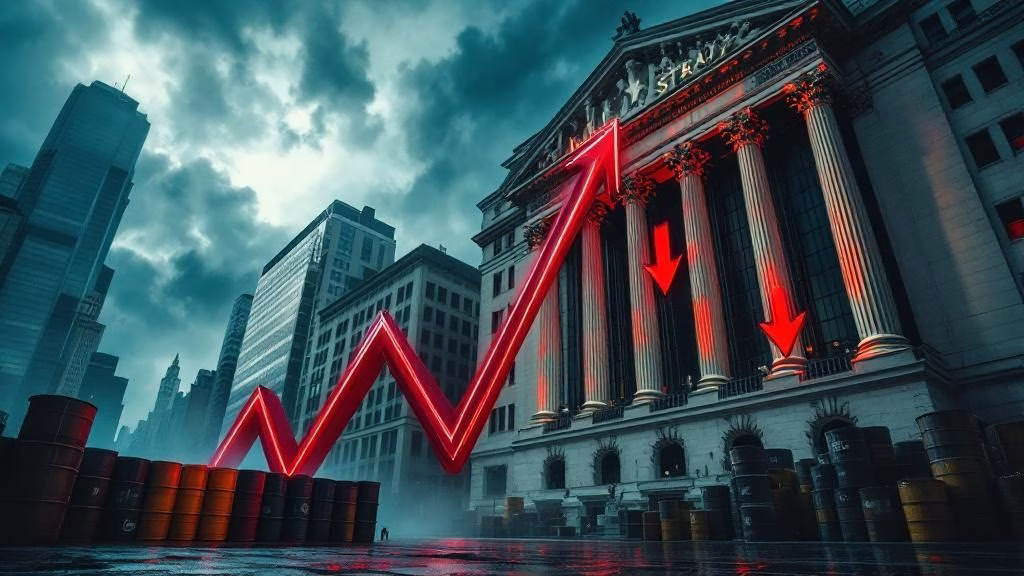
The stagflation risk stocks face today is unlike anything investors have encountered since the 1970s. As Brent crude surged past $100 per barrel on Thursday, March 12, the Dow Jones Industrial Average shed 739 points, the S&P 500 dropped 1.5%, and the Nasdaq Composite fell 1.8%. With Iran’s new supreme leader Mojtaba Khamenei vowing to keep the Strait of Hormuz effectively closed, markets are confronting the very real possibility of prolonged stagflation — a toxic combination of stagnant growth and rising inflation that the Federal Reserve has no easy tools to combat.

Why Stagflation Risk Stocks Fear Most Has Returned
Stagflation is the economic nightmare that combines the worst of both worlds: prices rise while economic output stalls. The term was coined during the 1970s oil crisis, and the parallels to today’s situation are striking. Back then, OPEC’s oil embargo sent crude prices soaring, consumer costs ballooned, and unemployment climbed. Today, the Iran conflict is playing a remarkably similar role.
The numbers tell a sobering story. Brent crude settled at $100.46 per barrel on Thursday — a 9.2% daily gain and the highest level since August 2022. Earlier in the week, prices briefly spiked near $120. The International Energy Agency (IEA) announced a record release of 400 million barrels from strategic reserves, but analysts warn this is a short-term fix that does nothing to address the underlying risk.
According to AP News reporting, if the Strait of Hormuz remains closed, oil prices could jump to $150 per barrel. A fifth of the world’s oil supply typically transits through this narrow waterway, and Persian Gulf producers are already cutting output because their crude has nowhere to go.
How Wall Street Is Responding to the Oil Shock
All three major U.S. indexes posted their lowest closing levels of 2026 on Thursday. The 30-stock Dow finished below 47,000 for the first time this year at 46,677.85. The S&P 500 closed at 6,672.62, now 4.4% below its January all-time high. While that doesn’t sound catastrophic, the speed and volatility of the moves have rattled traders.
The oil market’s structure reveals just how abnormal conditions have become. According to CNBC analysis, the Brent futures curve has flipped into steep backwardation. Front-month contracts trade above $100 while longer-dated contracts remain near $70. At the start of 2026, prices hovered around $60 in mild contango. This dramatic structural shift signals the market is pricing in acute near-term supply risks, not a permanent shift in oil fundamentals.
Sector Winners and Losers
Not every stock is suffering equally. Energy names like Chevron are trading at all-time highs, benefiting directly from elevated crude prices. Meanwhile, sectors with heavy fuel exposure are getting crushed:
- Cruise operators: Royal Caribbean dropped 5% and Carnival lost 6% as fuel is one of their largest operating costs.
- Airlines: Carriers face massive jet fuel cost increases, with some analysts estimating a $10 increase in crude adds $2-3 billion in annual industry costs.
- Consumer discretionary: Higher gasoline prices eat into household budgets, reducing spending on non-essentials.
- Retailers: Kroger, however, hit all-time highs — consumers still need groceries regardless of oil prices.
For a deeper look at how energy stocks are performing, our recent analysis of energy stocks during the oil surge identified several names positioned to benefit from sustained high prices.
The Federal Reserve’s Impossible Choice
Perhaps the most troubling aspect of the stagflation risk stocks must price in is the Federal Reserve’s limited ability to respond. The central bank faces a textbook lose-lose scenario:
- Cut rates to support a weakening economy → risk fueling already-rising inflation
- Raise rates to fight inflation → risk pushing the economy into recession
- Do nothing → risk being seen as behind the curve on both mandates

Mark Zandi, chief economist at Moody’s, told CNBC: “Fed officials will sit on their hands until they get some clarity around how the war with Iran is playing out and which of its mandates, low and stable inflation or full-employment, is most in jeopardy. That could take weeks, if not two to three months.”
Futures markets are pricing in almost zero chance of a rate cut at next week’s FOMC meeting, according to the CME FedWatch tool. This matters enormously for equities because much of the stock market’s 2024-2025 rally was built on expectations of easing monetary policy.
Labor Market Sends Mixed Signals
Adding to the stagflation narrative, last month’s U.S. jobs report was surprisingly weak, with the economy shedding 92,000 positions. Our coverage of the weak jobs report and the subsequent market selloff detailed how this raised red flags about the broader economic trajectory.
However, Thursday brought a modestly encouraging data point: weekly jobless claims came in lower than expected, suggesting the labor market isn’t in freefall. The Producer Price Index (PPI), on the other hand, showed higher-than-expected wholesale price growth — exactly the kind of inflationary pressure that feeds the stagflation thesis.
This conflicting data is precisely what makes stagflation so difficult to navigate. Traditional economic downturns show consistent signals: jobs weaken, inflation falls, the Fed cuts rates. Stagflation breaks that playbook entirely.
Historical Context: What the 1970s Teach Us
Investors seeking guidance from history should look at the 1973-1974 oil embargo and the 1979 Iranian Revolution. During both episodes:
- The S&P 500 fell roughly 40-50% from peak to trough in 1973-1974
- Inflation reached double digits (peaking at 14.8% in 1980)
- The Fed was forced to raise rates dramatically, with the federal funds rate eventually hitting 20% under Paul Volcker
- It took years, not months, for markets to fully recover
The good news? Today’s starting conditions are better. The U.S. is now a net oil exporter, the economy entered this crisis from a position of relative strength, and corporate balance sheets are healthier than in the 1970s. The S&P 500’s 4.4% decline from its highs is nowhere near crisis territory — yet.
Key Differences From the 1970s
Several structural factors differentiate today’s environment from the classic stagflation era:
- U.S. energy independence: America produces roughly 13 million barrels per day domestically, providing a significant buffer against Middle Eastern supply disruptions.
- Strategic Petroleum Reserve: The IEA’s coordinated 400-million-barrel release demonstrates that policymakers learned from past crises.
- Technology sector dominance: The modern S&P 500 is far less energy-intensive than its 1970s counterpart. Tech giants like Apple, Microsoft, and Nvidia have minimal direct oil exposure.
- Renewable energy growth: Solar and wind capacity has exploded, providing structural alternatives that didn’t exist in the 1970s.
What Investors Should Watch Next Week
The coming days will be pivotal for assessing whether the stagflation risk stocks face intensifies or moderates. Key events to monitor:
- FOMC meeting (March 18-19): The Fed’s statement and press conference will reveal how seriously officials view the stagflation threat. Any dovish signals could provide temporary market relief.
- Oil price trajectory: If Brent sustains above $100, the economic impact compounds daily. A return below $90 would ease pressure significantly.
- Diplomatic developments: Any signals of de-escalation in the Iran conflict would likely trigger a sharp oil reversal and stock rally. Our analysis of the recent crude oil crash on de-escalation hopes shows how quickly prices can reverse.
- Consumer sentiment data: Friday’s University of Michigan survey will gauge how rising gas prices are affecting consumer confidence.
Portfolio Positioning for a Stagflation Environment
If stagflation does materialize, history and current market dynamics suggest several portfolio adjustments:
Sectors that tend to outperform:
- Energy (direct beneficiary of higher oil prices)
- Consumer staples (Kroger’s all-time highs demonstrate defensive demand)
- Healthcare (relatively inelastic demand)
- Commodities broadly (hard assets hold value during inflation)
Sectors that tend to underperform:
- Growth stocks and tech (higher discount rates compress valuations)
- Consumer discretionary (squeezed household budgets)
- Travel and leisure (high fuel costs + lower consumer spending)
- Real estate (higher rates pressure valuations)
Bottom Line: Risk Is Elevated but Not Catastrophic
The stagflation risk for stocks is real and growing, but it’s not yet a foregone conclusion. Oil prices need to remain elevated for months — not days — to trigger a genuine stagflationary spiral. The U.S. economy’s structural advantages over the 1970s provide meaningful buffers. And the market’s 4.4% pullback, while uncomfortable, is well within normal correction territory.
That said, investors should not be complacent. The combination of $100 oil, a weakening labor market, sticky inflation, and a paralyzed Federal Reserve is a cocktail that demands attention. Position defensively, maintain cash reserves, and watch next week’s FOMC meeting closely. The Fed’s tone will tell us whether Washington views this as a temporary shock or the beginning of something worse.


