

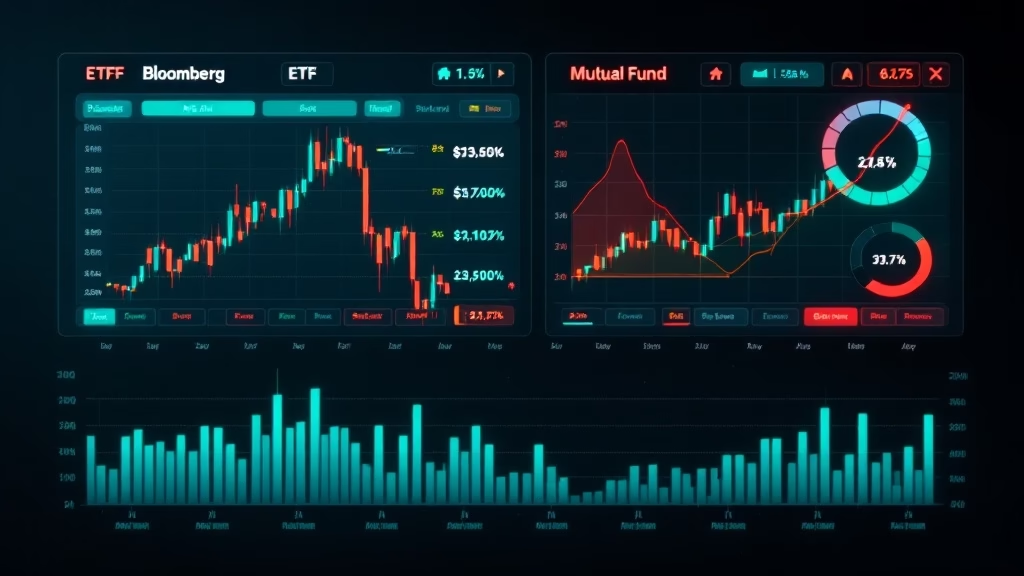

T. Rowe Price’s active ETF franchise crossed $25 billion in total assets under management as of Q1 2026, a milestone that five years ago would have seemed improbable for a firm built on the conviction that skilled human managers add value indexes cannot replicate. Eight individual ETFs now each hold more than $1 billion in assets. In Q1 alone, the 32-fund lineup attracted $2.8 billion in net inflows.
The dollar figure matters less than the signal it sends. Across the $25 trillion U.S. mutual fund industry, legacy active managers are converting assets, exploring ETF share class structures, and repricing flagship strategies to survive a structural shift the Investment Company Institute documents each week. The question is no longer whether active management migrates to the ETF wrapper. It is how fast.
Key Takeaways
- T. Rowe Price’s ETF suite topped $25B in AUM with $2.8B in Q1 2026 net inflows; 8 of its 32 funds each crossed $1B individually.
- Active ETFs globally hold $1.47 trillion in assets, growing at a 59% compound annual rate over the past three years.
- ICI’s March 2026 data shows long-term active mutual funds shed $25.87 billion while index funds gained $74.03 billion in a single month.
- Active ETFs accounted for 80% of all new ETF launches year-to-date in 2026, per the SEC DERA February 2026 research note.
- Full-year 2026 active ETF flows are on track to reach $620 billion, which would push total active ETF assets past the $2 trillion threshold.
From $5 Billion to $25 Billion: How T. Rowe Price Built Its ETF Platform

T. Rowe Price entered the ETF market in 2020 deliberately. It did not pursue a conversion of its mutual fund lineup or rush thematic launches to capture short-term attention. Instead, it ported core equity and fixed income strategies (run by the same portfolio teams managing the mutual fund versions) into ETF wrappers and let the business build organically.
By March 31, 2026, the result was a 32-fund lineup with $25 billion in total AUM. CEO Rob Sharps confirmed on the Q1 earnings call April 30, 2026 that the company is developing plans to launch its first ETFs in Europe, targeting a market where active ETFs barely existed two years ago.
Two flagship ETFs now carry a 0% expense ratio: the T. Rowe Price Active Core U.S. Equity ETF (TACU) and the Active Core International Equity ETF (TACN) both charge no fee through January 30, 2027. Sharps framed this explicitly as a market expansion play. Most new ETF assets, he noted, come from investors who previously held no T. Rowe mutual funds, meaning the ETF channel is widening the addressable market rather than pulling assets from the mutual fund side.
T. Rowe’s ETF strategy rests on three pillars: coverage across all Morningstar categories, integration into model portfolio structures at home offices and RIA platforms, and new delivery formats for evolving investment capabilities. Each reflects where distribution has moved. Model portfolios now dominate fund selection at large advisory firms, and ETFs are the preferred vehicle for those models.
What ICI’s March 2026 Data Shows About the Flow Picture
ICI’s March 2026 active/passive breakdown makes the structural shift hard to argue with. Long-term active mutual funds recorded net outflows of $25.87 billion in March. Long-term index funds took in $74.03 billion. That roughly $100 billion gap in a single calendar month is not a one-time event. It reflects a decade-long directional shift that market volatility slows but does not reverse.
Weekly ICI data confirms the picture. For the week ended May 13, 2026, mutual funds across all categories saw net outflows of $18.29 billion while ETFs posted $57.27 billion in net issuance. The pattern holds: money exits the mutual fund wrapper and enters the ETF structure, across both passive and active strategies.
SPIVA data adds context that complicates the active management case without slowing the flow story. The most recent scorecard, published in early 2026, found that 79% of large-cap U.S. equity active funds underperformed the S&P 500 in 2025. Over a ten-year horizon, only 24% of active ETFs beat their benchmarks. T. Rowe Price and its peers are not disputing these numbers in their marketing. They are making a different argument: the ETF vehicle delivers real structural advantages (tax efficiency, intraday liquidity, lower minimums) regardless of whether any specific active strategy outperforms its index.
Why Are Active ETFs Growing When Most Active Funds Underperform?
The answer is not about manager skill. It is about the vehicle.
Active ETFs offer daily tax-lot harvesting potential, intraday pricing, no minimum investment thresholds beyond one share, and compatibility with the model portfolio infrastructure that drives modern advisory distribution. They fit into brokerage sleeves, UMA accounts, and direct indexing platforms in ways that mutual funds, with their NAV-based pricing and redemption constraints, do not.
The SEC’s own research confirms the scale of what is happening. A February 2026 DERA note found that active ETFs account for roughly 80% of new ETF launches year-to-date in 2026. A record 962 active ETFs launched in calendar year 2025 — the first year active fund counts exceeded passive fund counts in ETF product rosters. In 2025, active ETFs attracted $459 billion in net new flows, representing 31% of all ETF inflows. Total active ETF assets now stand at $1.47 trillion, up at a 59% compound annual rate over three years.
January 2026 alone produced $65 billion in active ETF inflows, nearly 40% of the month’s total ETF flows. If that pace continues, full-year 2026 active ETF flows could reach $620 billion, pushing total assets past the $2 trillion mark before year-end, per projections from ETF.com and Bloomberg Intelligence.
Home office model portfolios at major wirehouses and RIA aggregators increasingly include active ETFs as core allocation components alongside passive index ETFs, not as satellite positions. T. Rowe Price’s distribution strategy reflects this: its ETF marketing targets advisors building models, not retail investors selecting individual funds.
How Other Legacy Managers Are Responding
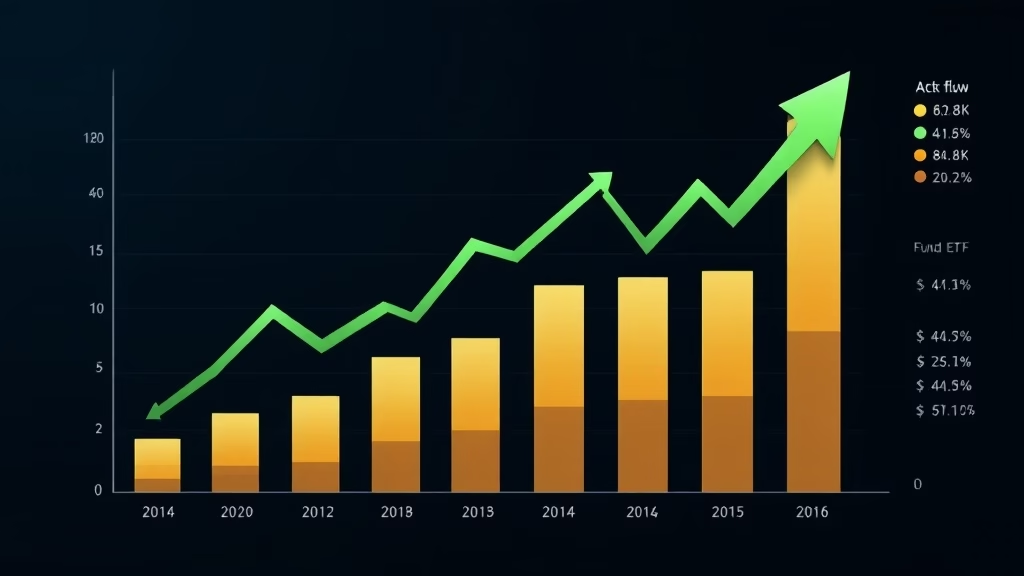
T. Rowe Price is not the only active manager reorienting its product lineup. The picture across the industry has changed materially since 2023.
Capital Group, whose American Funds franchise has long anchored advisor-distributed mutual fund portfolios, now manages a growing active ETF lineup. After a slow initial rollout, Capital Group’s ETF assets have gained traction, though the firm still manages the bulk of its $2.6 trillion in AUM through mutual fund share classes in adviser-sold channels. The Broadridge Fund Brand 50 study in early 2026 placed Capital Group ahead of Vanguard in brand equity among advisors, a standing built largely on mutual fund relationships that ETF competitors have not yet eroded.
Franklin Templeton has filed multiple 485BXT amendments with the SEC in 2026, updating ETF offerings under its trust. Several per month, the filings reflect systematic product expansion across asset class categories rather than opportunistic launches timed to market trends.
Dimensional Fund Advisors, managing approximately $770 billion in AUM, completed the conversion of its entire mutual fund platform to ETFs in prior years. Its ETF assets exceed $200 billion. Dimensional’s conversion has become a reference model for mid-size active managers watching their mutual fund assets age and outflows compound.
American Century, which manages $250 billion, published a research note in 2026 titled “ETFs Defying Gravity: Record Inflows Drive Another Chart-Topping Year,” calling the ETF inflow pace extraordinary by historical standards. The firm has expanded its active ETF lineup and targets financial advisors building fee-based models as its primary distribution audience.
Is the Mutual Fund Wrapper Dead?
Not dead, but visibly contracting. The $25 trillion U.S. mutual fund market still dwarfs the $1.47 trillion active ETF universe by a factor of 17 to 1. But the growth differential tells the real story. New money goes into ETFs. Redemptions come from mutual funds. The asset base shrinks slowly, with long-tail inflows from 401(k) auto-enrollment preventing a sharper contraction, at least for now.
The structural innovation that could slow mutual fund outflows is the ETF share class. T. Rowe Price confirmed on its Q1 2026 earnings call that ETF share class development is under review for certain strategies. The SEC approved the first ETF share class exemptive applications in 2025, opening a regulatory path that had been closed since 2019, when Vanguard’s patent on the structure expired.
If the SEC issues broad exemptive relief in mid-2026, advisors could eventually access the same T. Rowe Price portfolio (whether the Capital Appreciation Fund or the Equity Income strategy) through either a mutual fund share class or an ETF share class from the same underlying vehicle. That would let the firm’s mutual fund assets age in place while new money enters through the ETF structure, avoiding a forced conversion that would disrupt existing investors.
That outcome would preserve the mutual fund wrapper while conceding distribution primacy to the ETF structure. For advisors building model portfolios, a share class addition would be operationally cleaner than tracking two separate tickers for the same strategy.
What Advisors Are Watching in Q3 2026
A few developments this quarter will test whether the active ETF pivot has structural legs or is simply underperformance repackaged in a more tax-efficient wrapper.
European ETF expansion is the first. T. Rowe Price’s planned European launch will encounter a market with different architecture: UCITs wrappers, trailer fee bans in several countries, and sophisticated allocators who have long evaluated active strategies without the cultural attachment to mutual funds that U.S. advisor channels carry. Success there would validate active ETF demand as a structural global phenomenon rather than a U.S. distribution story.
ETF share class regulatory timelines matter next. If the SEC processes pending applications through Q3 2026, announcements from large active managers could reshape the distribution conversation before year-end. T. Rowe Price, Capital Group, and American Funds are likely among the first movers if broad relief is granted.
The SPIVA mid-year update is the third. The scorecard covering Q1 2026 is expected in summer 2026. If the volatility of early 2026 markets (driven by tariff uncertainty and rate recalibration) lifted active fund performance relative to benchmark, active managers will use those numbers aggressively in ETF marketing. A modest outperformance quarter will not reverse the decade-long trend, but it will sharpen the sales pitch at the advisor level.
Related reading: JPMorgan Becomes the Largest Active ETF Issuer, Surpassing Dimensional, Active ETF Launches Hit Record as Mutual Fund Count Hits Lowest Level Since 1983, Vanguard’s $250 Million Fee Cut: What It Means for the Active-Passive Fee War.
Questions for Your Investment Committee
- Which active ETFs in your model portfolio allocation have track records of three years or more under the ETF wrapper, and which are running the strategy live for the first time in ETF format with backtested performance as the only reference?
- If a manager you hold in mutual fund form launches an ETF share class of the same strategy, what is the minimum fee savings and tax efficiency threshold that would justify a migration, and what are the operational steps for transitioning 401(k) and taxable accounts separately?
- Does your firm have a position on whether active ETF outperformance data in volatile quarters (such as Q1 2026) changes your manager due diligence process, or does your policy rely on longer-horizon SPIVA comparisons?
About Me

Founder and Chief Research Analyst at Trading Market Signals. Abdelali El Khadmaoui specializes in AI Wealth Intelligence, Wealth Management, Registered Investment Advisors (RIAs), Family Offices, Retirement Planning and Private Credit. He publishes in-depth research and data-driven analysis for financial professionals.