


BlackRock and GeoWealth turned on what iCapital called the first customizable public-private model portfolio inside a Unified Managed Account, with private market assets making up about 15% of the initial portfolio mix. The launch pairs two existing BlackRock alternatives funds — the $1.1 billion BlackRock Private Credit Fund and the $300 million BlackRock Private Investments Fund — with direct-indexed equities, fixed-income separately managed accounts, ETFs, and mutual funds in a single UMA wrapper. Distribution is exclusive to GeoWealth’s RIA network, with iCapital providing the underlying private-asset technology layer. For independent advisors who have spent two years asking how to put private credit in front of clients without forcing them through a 30-page subscription document, the structure removes the friction in one wrapper.
Key takeaways
- BlackRock and GeoWealth went live with a UMA-wrapped public-private model portfolio for RIAs. Private market assets start at ~15%, with capacity to expand into infrastructure and additional private credit.
- The initial private sleeve uses two existing BlackRock funds: the $1.1 billion Private Credit Fund and the $300 million Private Investments Fund.
- iCapital supplies the private-asset technology; GeoWealth’s UMA platform handles the public-private orchestration; BlackRock provides the strategic asset allocation framework.
- The launch fits a broader 2026 shift: Goldman Sachs reported semi-liquid retail NAV reached $426 billion in Q3 2025, a 40% CAGR since 2021, dominated by direct-lending private credit (~50% of retail private wealth NAV).
- Apollo Global Management crossed $1 trillion in AUM and plans daily pricing for credit funds by end of September 2026; JPMorgan filed for a private credit fund with 7.5% quarterly redemptions.
What BlackRock and GeoWealth Actually Built
The product is a Unified Managed Account, not a fund. That distinction matters because a UMA holds multiple sleeves inside one client account with one tax lot, one statement, and one rebalancing engine. Until this launch, public sleeves (ETFs, mutual funds, SMAs) and private sleeves (interval funds, BDCs, tender-offer funds) lived in separate accounts at separate custodians, each with its own subscription paperwork.
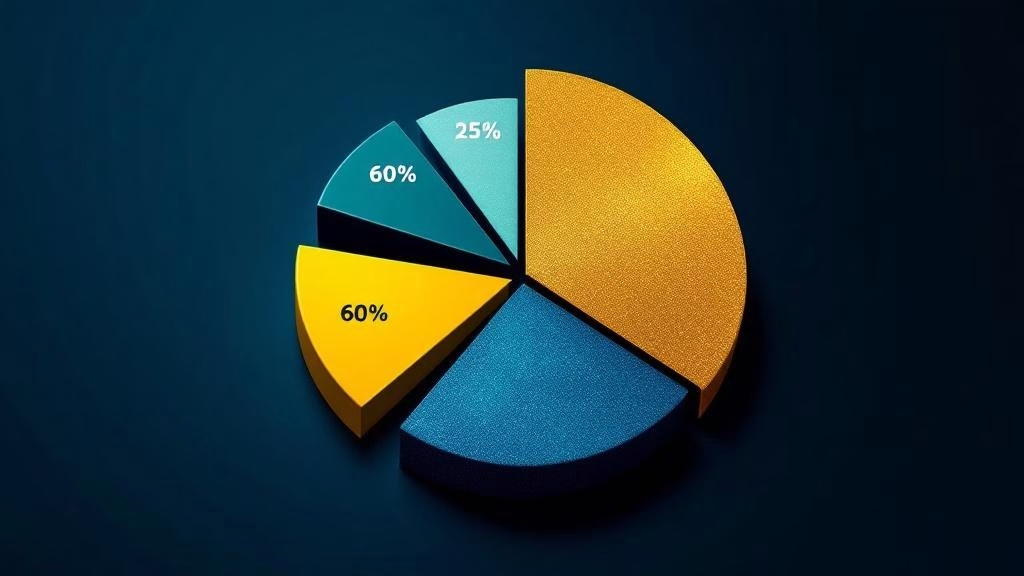
The BlackRock-GeoWealth UMA mixes both inside a single account. The default allocation, as reported by InvestmentNews, runs roughly 60% public equities (direct-indexed plus ETFs), 25% public fixed income (fixed-income SMAs plus bond ETFs), and 15% private markets. The 15% private sleeve initially holds shares of the $1.1 billion BlackRock Private Credit Fund and the $300 million BlackRock Private Investments Fund, both of which were already available to retail through iCapital but had to be transacted through a parallel account structure.
GeoWealth’s UMA technology handles the rebalancing logic across liquid and illiquid sleeves. iCapital handles the subscription-document automation, accreditation verification, and subscription-window management for the private-fund pieces. BlackRock sets the strategic asset allocation and supplies the underlying funds. The combination compresses what was previously a multi-week onboarding into a single advisor workflow.
Why Is the 60/40 Allocation Losing Defenders in 2026?
The 60/40 portfolio survived 2022’s joint stock-bond drawdown by accident more than design. The argument for 60/40 has always been that bonds offset equity volatility. When inflation surged in 2022, that correlation flipped positive: bonds and stocks fell together. Apollo’s 2026 wealth research framed the issue clearly: with most lending and credit creation now happening in private markets, a portfolio that lacks private credit exposure systematically misses the largest source of credit beta in the modern economy.
BlackRock’s own framing, in its 2026 Private Markets Outlook for U.S. Wealth, argues that a 60/40 portfolio retrofitted with 20% liquid alternatives historically produced returns of approximately 9.2% versus 6.7% for plain-vanilla 60/40, at a similar risk level. The firm is now distributing that argument through model portfolios rather than white papers.
The shift is also a competitive response. KKR, Apollo, and Blackstone have all built direct retail distribution channels for private credit. BlackRock had to either match the distribution speed or watch trillions of dollars of wealth-management assets default to the firms that solved retail access first. GeoWealth gives BlackRock an RIA channel that bypasses the wirehouse approval committees and goes straight to the independent advisor desk.
Inside the 15% Private Sleeve: Credit, Equity, and What Comes Next
The two initial private-fund holdings tell the strategy.
The BlackRock Private Credit Fund is a non-listed BDC that invests primarily in senior secured direct loans to U.S. middle-market companies. At $1.1 billion in net assets, it is large enough to maintain diversification across roughly 100-150 portfolio companies, which is the threshold most institutional allocators require for direct-lending BDC inclusion. Yields in the strategy have run in the 9-11% range gross, before fees, through 2025 and into 2026.
The BlackRock Private Investments Fund is a multi-strategy private equity vehicle that allocates across primary commitments, secondaries, and co-investments in private equity funds. The $300 million net asset base is smaller, but the fund-of-funds structure provides exposure to underlying primary GP commitments at Apollo, KKR, Carlyle, and similar large-cap PE managers without forcing the advisor’s client into a single-manager concentration.
iCapital’s launch communication noted that the model portfolios have capacity to incorporate additional alternatives, specifically infrastructure and additional private credit, over time. BlackRock’s separate January 2026 launch with Partners Group of a private markets SMA for wealth platforms signals that infrastructure and real assets are likely the next sleeves added to the GeoWealth UMA, probably during 2027.
What’s the Liquidity Trade-Off for the Advisor’s Client?

This is the question every fiduciary advisor has to answer before allocating. The two BlackRock private funds use semi-liquid structures with quarterly redemption windows and gating provisions. The BlackRock Private Credit Fund typically allows up to 5% of net assets to be redeemed per quarter, with the board reserving the right to suspend or limit redemptions if outflows exceed capacity.
Apollo Global Management is moving the industry standard. The firm crossed $1 trillion in assets under management in early 2026 and announced plans to begin daily pricing for its credit funds by the end of September 2026, responding directly to wealth-management distribution demand for tighter pricing transparency.
JPMorgan filed in March 2026 for a private credit fund with quarterly redemption capacity of 7.5%, higher than the typical 5% interval-fund standard. The structure is a direct response to what JPMorgan called an unprecedented liquidity challenge in the $1.8 trillion private credit market.
The takeaway for advisors: liquidity terms are tightening across the industry, but no semi-liquid private credit vehicle is daily-liquid. A 5% or 7.5% per-quarter redemption cap means that if 100% of investors wanted to exit at the same time, the exit would take a minimum of 14 to 20 quarters. The semi-liquid wrapper is a liquidity premium over closed-end private funds, not a substitute for ETF liquidity. Client suitability documentation has to reflect that math. Our Private Credit Redemption Monitor follows how much of each quarter’s redemption requests these semi-liquid funds are clearing.
The Private Credit Liquidity Question Hanging Over the Industry
The launch arrives against a more cautionary backdrop than BlackRock’s marketing acknowledges. Fortune reported in March 2026 on what it called a $265 billion private credit liquidity panic, with several large managers facing redemption queues that exceeded quarterly capacity. A.L. Capital Advisory, in its May 2026 private equity sector review, maintained High Conviction ratings on Blackstone and KKR but downgraded Apollo and Ares on private credit liquidity concerns.
The data underneath the panic is more nuanced. Default rates in the BlackRock Private Credit Fund and similar large-platform BDCs remained below 2% through 2025. The stress is concentrated in smaller, single-manager private credit funds with thin underwriting standards, not in the diversified large-platform vehicles that anchor model portfolios at BlackRock, Apollo, and KKR.
J.P. Morgan Private Bank’s May 2026 note on private credit framed the question for the retail wealth segment specifically: at this point in the cycle, in these structures, with these fees, does the current risk-reward proposition justify a new allocation? The firm’s answer for income-oriented clients was a qualified yes, with the caveat that allocations should sit inside diversified multi-manager models rather than concentrated single-fund positions. That framing aligns directly with the BlackRock-GeoWealth model portfolio architecture.
What to Watch in the Second Half of 2026
Three signals likely to shape allocation decisions through year-end:
Apollo’s daily-pricing rollout. If Apollo successfully delivers daily NAV pricing for credit funds by September 2026, the entire industry pricing standard moves. BlackRock and Blackstone will need to match or face advisor pushback on weekly or monthly NAV cycles that look stale by comparison.
SEC rule on interval fund and BDC redemption capacity. The SEC has signaled that it is reviewing the regulatory framework for retail private credit vehicles. Any rule that mandates higher minimum redemption capacity would force product redesign across the industry.
Wirehouse platform decisions. Morgan Stanley, Merrill, UBS, and JPMorgan Wealth Management have moved cautiously on adding private credit model portfolios to their advisor menus. If one wirehouse approves the BlackRock-GeoWealth structure for its RIA-channel platform, the others typically follow within two quarters.
Questions Advisors Should Ask Before Allocating
For the next investment committee meeting, three concrete questions:
- What is the client’s documented liquidity floor? A 15% allocation to semi-liquid private credit assumes the client has at least 18 to 24 months of operating liquidity elsewhere in the portfolio. Confirm that the broader portfolio liquidity ladder supports the gating risk.
- How does the model portfolio rebalance the private sleeve during market stress? If equities fall 25% and private credit NAVs lag by two quarters, the model will mechanically need to sell private holdings to rebalance. Confirm how GeoWealth’s UMA logic handles non-tradable rebalancing requests.
- What is the fee load at every level of the stack? UMA fee, BlackRock fund fee, iCapital platform fee, and GeoWealth advisory fee can stack to 200 basis points or more annually before net returns. Net-of-fees comparison versus a 60/40 with liquid alternatives should be modeled before allocating.
For practitioners reassessing model-portfolio architecture, the parallel coverage on Vanguard’s BondBuilder fixed income model portfolios shows how the public-side allocation question is moving toward target-maturity precision, while the cash-like Treasury ETF analysis on SGOV, BIL, and BOXX covers the short-duration liquidity sleeve that has to sit alongside any private-credit allocation. The JPMorgan active ETF leadership analysis provides additional context on how the largest wealth platforms are reshaping public-market product design in parallel with the private-markets push.
As of May 2026. Portfolio construction decisions depend on individual client circumstances. This article is informational, not investment advice.
About Me

Tradingmarketsignals serves as the definitive digital ecosystem for the modern wealth management community. As a premier source of intelligence, it delivers high-level analysis, regulatory updates, and technological insights tailored specifically for independent financial advisors, RIA leaders, and investment professionals.


 Just as They Gate Redemptions: The Liquidity Factor Sponsors Must Document")

